AugurMax Asset Allocation Changes 2026-06-30
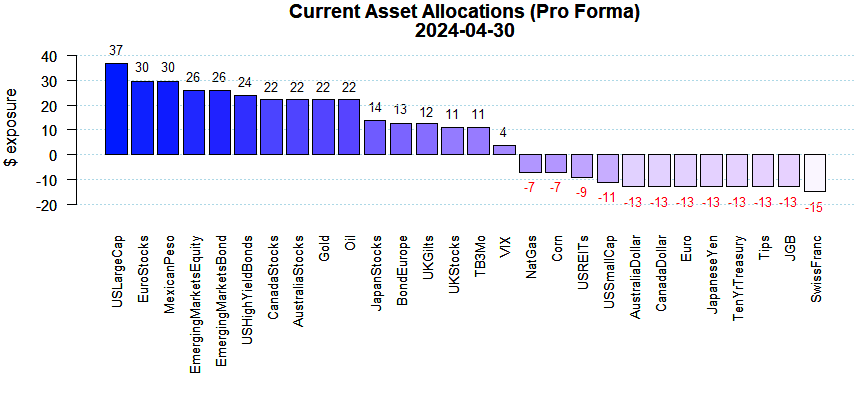
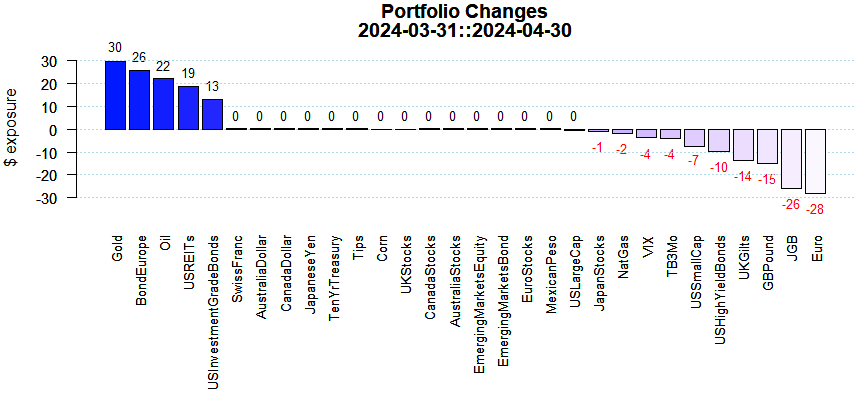
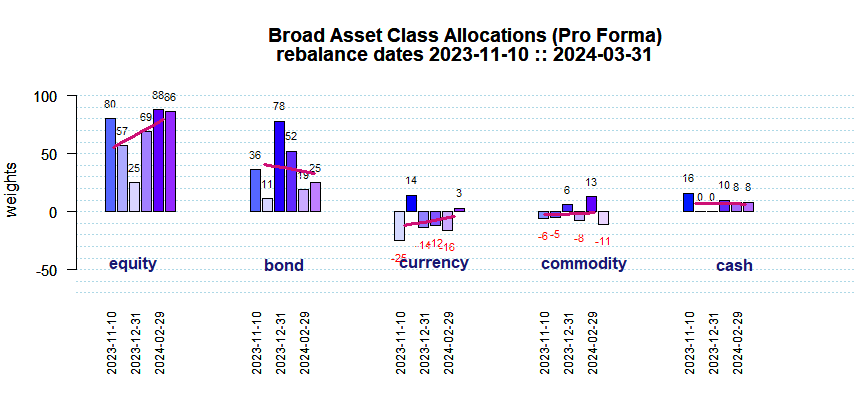
Equity exposure was reduced at the end of June as stocks around the globe continued their climb after the 2026-03-30 nadir and the cuts were widespread. VIX exposure moved up augmenting the downward stock exposures. Stocks outperformed the other broad asset classes handily. Current stock exposures are below their longer-term average. Bond exposures jumped and they are well above their long-term average weighting. The prescribed Currency exposure is quite negative and well below its long term weighting. Commodity exposure is flat and marginally below its longer term weighting.
Equity additions were highly selective as Australia and US Small Caps got the biggest raises. Emerging Markets and Japan were cut substantially. A positive VIX exposure represents a negative bet on US equities. Interest sensitive US REITs were kept essentially the same.
All Bond asset classes were added to and US Investment Grade and UK Gilts got the most. Cash exposure ratcheted up.
There were quite a few shifts within commodities where NatGas was brought up the most; Oil was cut but maintained a positive tilt.
Currency returns were down across the board in June as money continued to flow towards the US Dollar. Only the Japanese Yen was added to and substantial cuts were made to the GB Pound, the Swiss Franc, and the Aussie Dollar.
June’s global stock rally continued the sharp gains from April and May. Value stocks greatly outperformed growth stocks as tech stocks finally took a breather. Bonds were mixed around the globe but in aggregate wound up flat. Europe Bonds and those in Japan lead the pack. US Treasuries outperformed US Tips hinting at a lower inflation situation (see breakeven inflation rates). US Large Caps are now more than 52% above their April 2025 lows (see worst drawdowns) and hedge funds reported strong June returns. The prescribed changes herein are largely influenced by our ECO methodology. Performance results (on a stand-alone basis) for assets like Gold and others using our ECO metrics are shown here.