
Bubbles, crashes, rallies, and corrections
Fundamental, cyclical, and emotional factors influence financial markets and can be observed in market prices. Over various time frames, prices can exhibit non-random behavior such as trending, mean-reversion, or bubbles. These price patterns arise in all global markets and can be exploited profitably given adequate liquidity.
But price patterns are transitory and poorly understood by most discretionary investors. The Efficient Crashes Optimizer (ECO) asset price model identifies signatures in price data indicating potential crashes or rallies and estimates the magnitudes, the probabilities, and the timing of expected moves.
In the examples below, various predictions for several assets are highlighted in the table. We track the forward-tested results of these predictions by using the ‘hedge’ column to weight each asset return. Note that some assets can be levered up to 2X.
In addition to the assets shown here, predictions/trading signals can be calculated on a variety of individual or index returns of equities, fixed income, commodities, or currencies over various periodicities.
Our timing tools have shown benefits across a wide variety of assets.
TO SUBSCRIBE, please contact kreuser@riskontroller.com or robert@bifrostquestcapital.com. For ongoing developments, please fill in the sign-up boxes above.
ECO Bubble Predictions
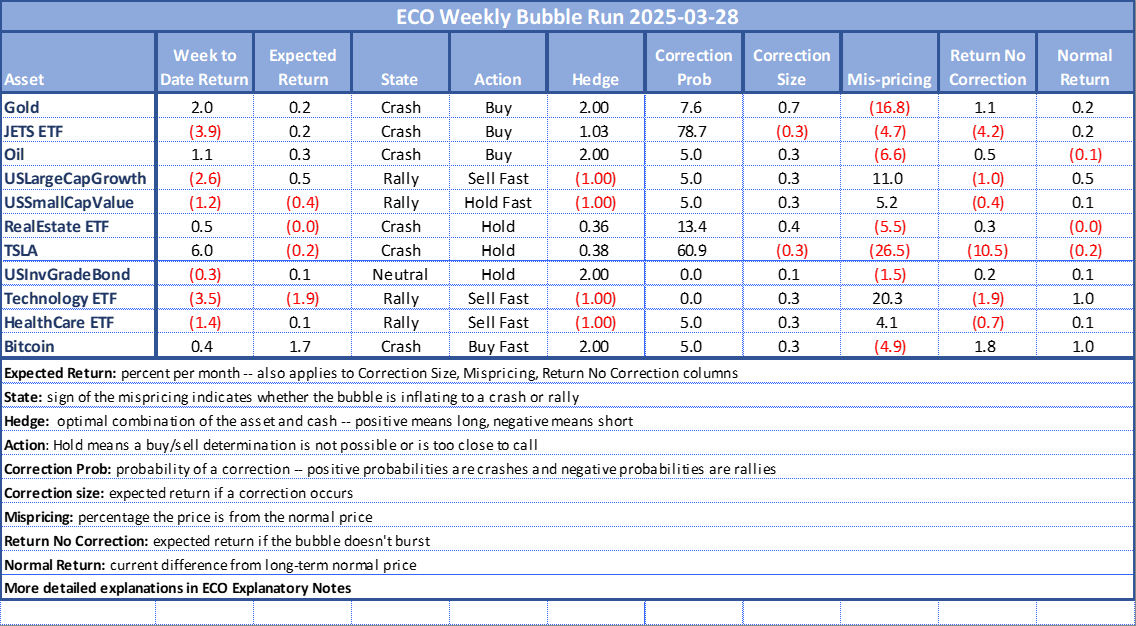
- Gold – Gold was down big last week after a big gain the prior week; ECO hedge’s efficacy in timing the precious metal has started to improve; ECO metrics show gold staying in a rally state; little change in metrics — maintain sell.
- JETS ETF – The airline ETF rose for a fourth week as oil prices weakened further; ECO metrics show JETS staying in a rally state; expected return slips but return no crash goes positive — downgrade to hold.
- USLargeCapGrowth – The style index posted a gain after a fourth week streak of losses but AI doubts lingered; growth stocks showed a rare win over value; stays in rally mode; both expected return and return no crash fall quite a bit and remain negative — maintain hold.
- USSmallCapValue – The high book-to-price small cap universe recorded a gain for the week but lost to the growth side of the small cap market; bubble type stays in crash mode; little change in metrics — maintain buy.
- RealEstate ETF – The Real Estate ETF was up for a fifth week but lost to the overall market even as rates rose; stays in a crash state; both expected return and return no crash slip — maintain buy.
- TSLA — The vehicle maker rebounded (along with the tech sector) for the week; extreme volatility persists; stays in a rally state; little change in metrics — maintain buy.
- USUnvGradeBond — This bond grouping was down sharply for the week after five weeks of gains; inflation reports pummeled bonds for the week; stays in a rally state; little change in metrics — maintain buy.
- Technology ETF – XLK was up big for the week after a crushing five weeks of losses; outperformed its large cap growth cohort quite a bit; tech drops to the #4 position YTD; both expected return and return no crash advance but stay negative — maintain hold.
- HealthCare ETF – Healthcare was up for the week performing slightly below the market; when tech wins, health care typically loses and vice versa; stays in a crash state; return no crash drops but stays positive — maintain buy.
The simulated performance of this list is tracked here. For more details see ECO Overview, Notes, and Details
“WEBSITE AND THE INFORMATION CONTAINED HEREIN IS NOT INTENDED TO BE A SOURCE OF ADVICE OR CREDIT ANALYSIS WITH RESPECT TO THE MATERIAL PRESENTED, AND THE INFORMATION AND/OR DOCUMENTS CONTAINED IN THIS WEBSITE DO NOT CONSTITUTE INVESTMENT ADVICE.”
To download historical ECO scores or more information, contact kreuser@riskontroller.com.
ECO scores are an important input in the AugurMax investment process. A powerful, cutting edge asset allocation engine is created when combining ECO scores with the RisKontroller optimizer.